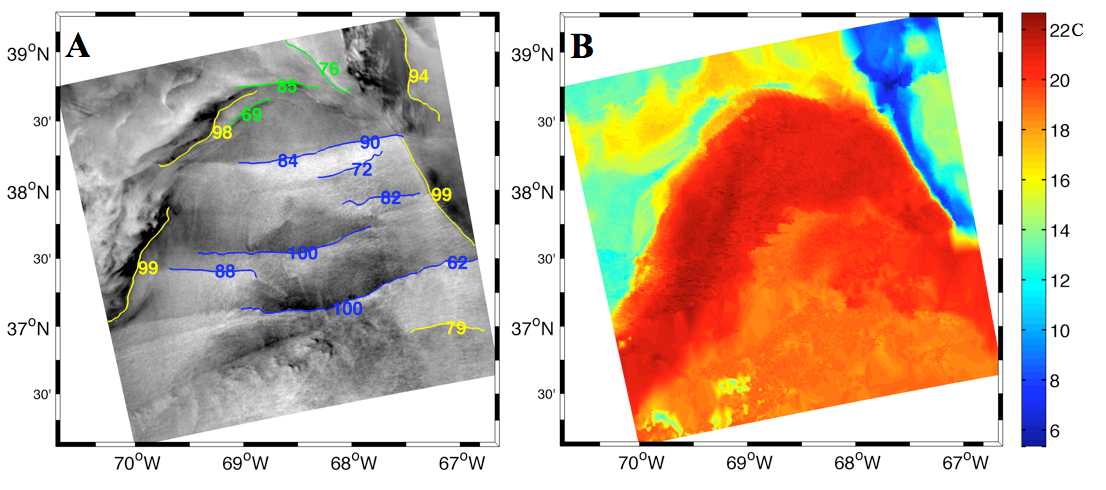
Panel A is a RADARSAT-2 image. Panel B is correspondign composite SST image from MODIS. The colored lines within Panel A are Canny edges. The number next to each edge is the percent probability that it is an SST front signature. Only five, those marked in yellow, were determined to correspond to actual SST fronts. Other colors are discussed within the text of Jones, C. T., T. D. Sikora, P. W. Vachon, and J. Wolfe, 2012: Towards automated identification of sea-surface temperature front signatures in RADARSAT-2 images. J. Atmos. Oceanic Technol., 29, 89-102. See also Jones, C. T., T. D. Sikora, P. W. Vachon, J. Wolfe, and B. DeTracy, 2013: Automated discrimination of certain brightness fronts in RADARSAT-2 images of the ocean surface. J. Atmos. Oceanic Technol., 30, 2203-2215.