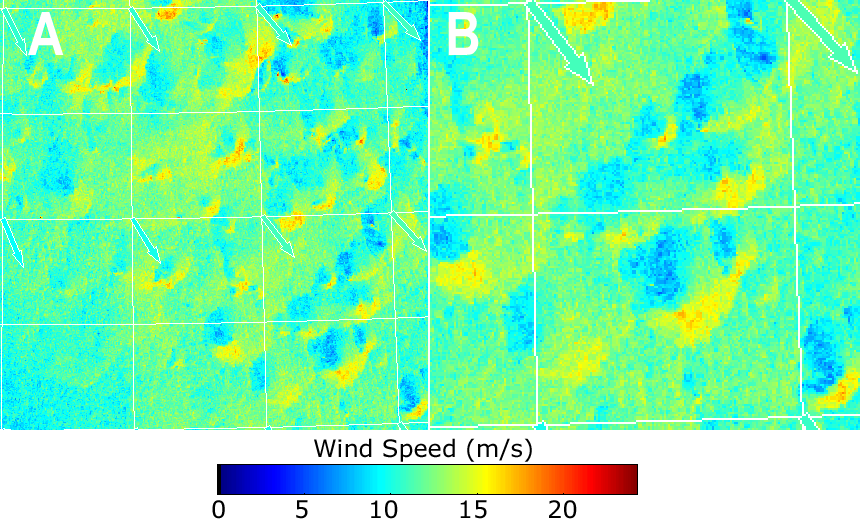
A: RADARSAT-1 600 m pixel wind speed image valid at 0253 UTC on 29 October 2006 . The image has been cropped to show part of the Gulf of Alaska and is centered near 52° N, 136° W. The image is 428 by 431 pixels. B: Zoomed version of A on several well defined examples of the squall and lull patterns associated with open cell convection. The pale blue arrows indicate the NOGAPS wind directions. The thin white lines form a 1° latitude-longitude grid. For more information, see Young, G. S., T. D. Sikora, and C. M. Fisher, 2007: Use of MODIS and synthetic aperture radar wind speed imagery to describe the morphology of open cell convection. Can. J. Remote Sens., 33, 357-367. Also see Sikora, T. D., G. S. Young, C. M. Fisher, and M. D. Stepp, 2011: A synthetic aperture radar-based climatology of open cell convection over the northeast Pacific Ocean. J. Appl. Meteor. Climatol., 50, 594-603.